Projects
What Actually Predicts NFL Wins?
Description
An end-to-end data analytics project answering a real business-style question: which team performance metrics should an NFL front office prioritize to maximize win probability? Built entirely from raw play-by-play data through to an interactive executive dashboard.
Key Contributions
- Wrote a SQL pipeline aggregating 244,000+ plays from the 2019-2023 seasons into team-season efficiency metrics (SQLite).
- Used Python (Random Forest, linear regression) to rank which stats most predict wins, reaching a held-out R² of 0.78.
- Designed a 4-page interactive Power BI dashboard, including a Chicago Bears case study and a plain-English glossary for non-football viewers.
Outcome
Found that offensive efficiency (EPA per play) is by far the strongest predictor of wins — and that the Bears have trailed the league average on it in every season from 2019-2023.
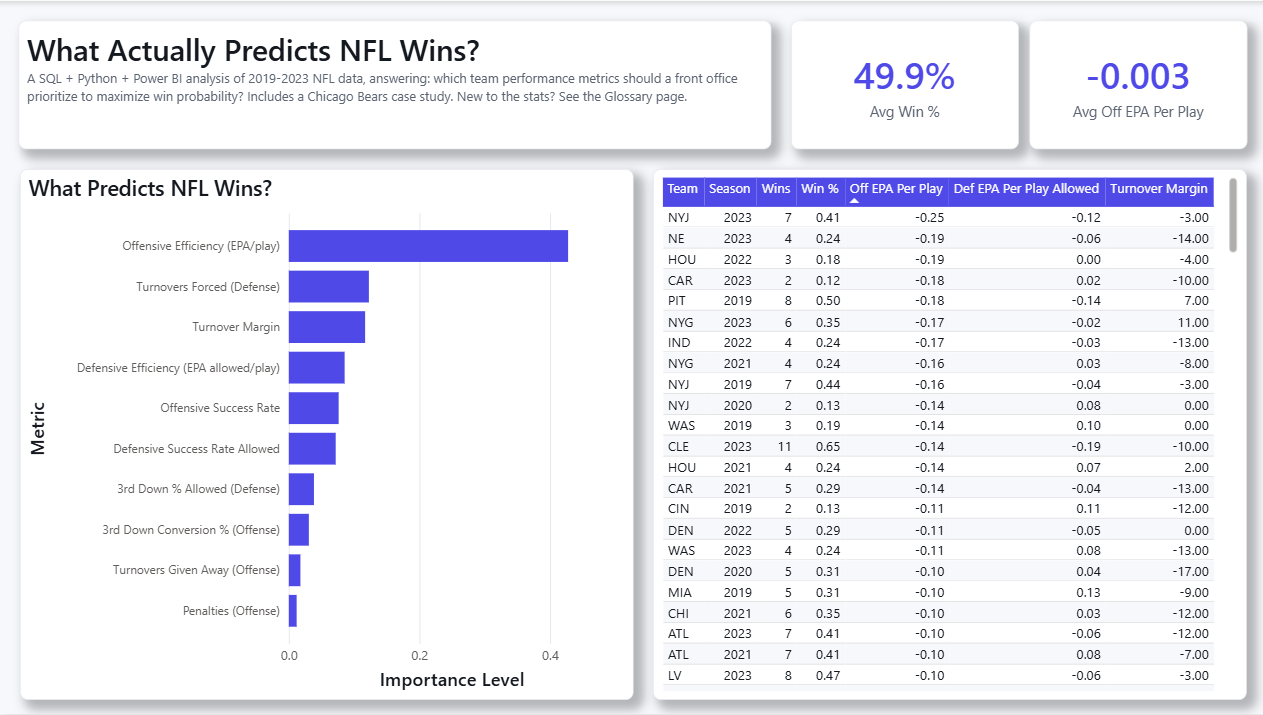
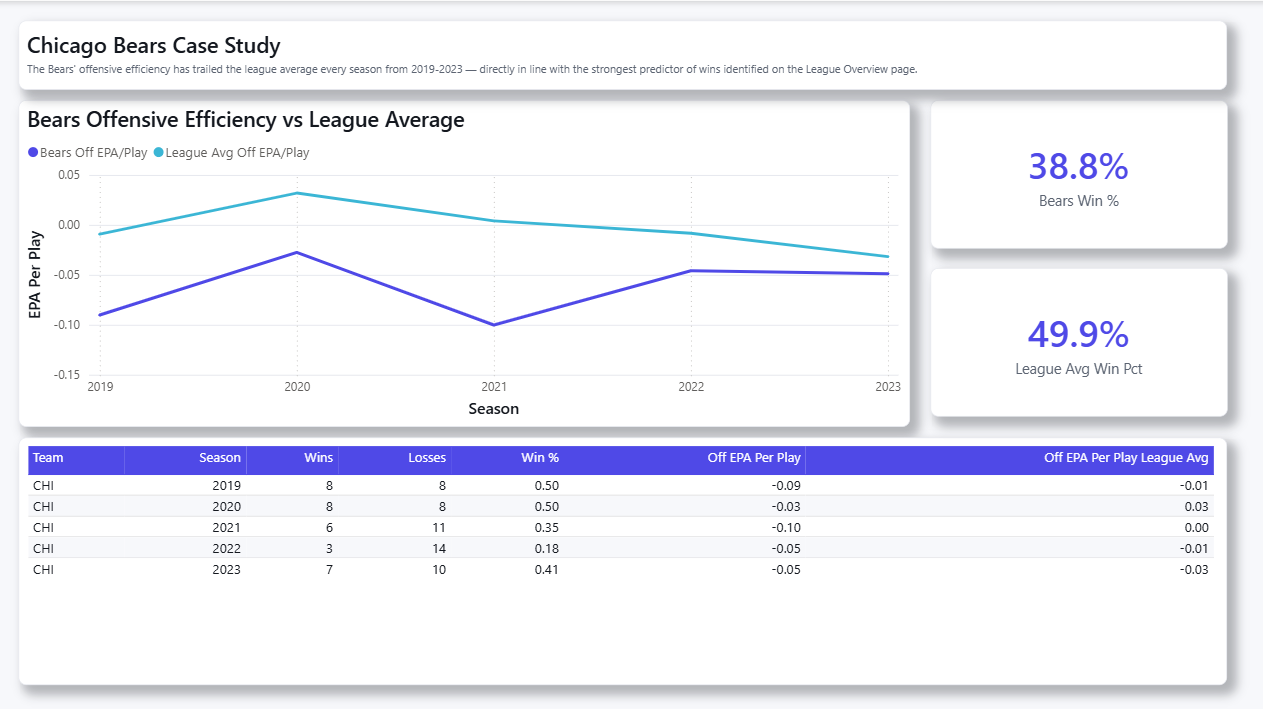
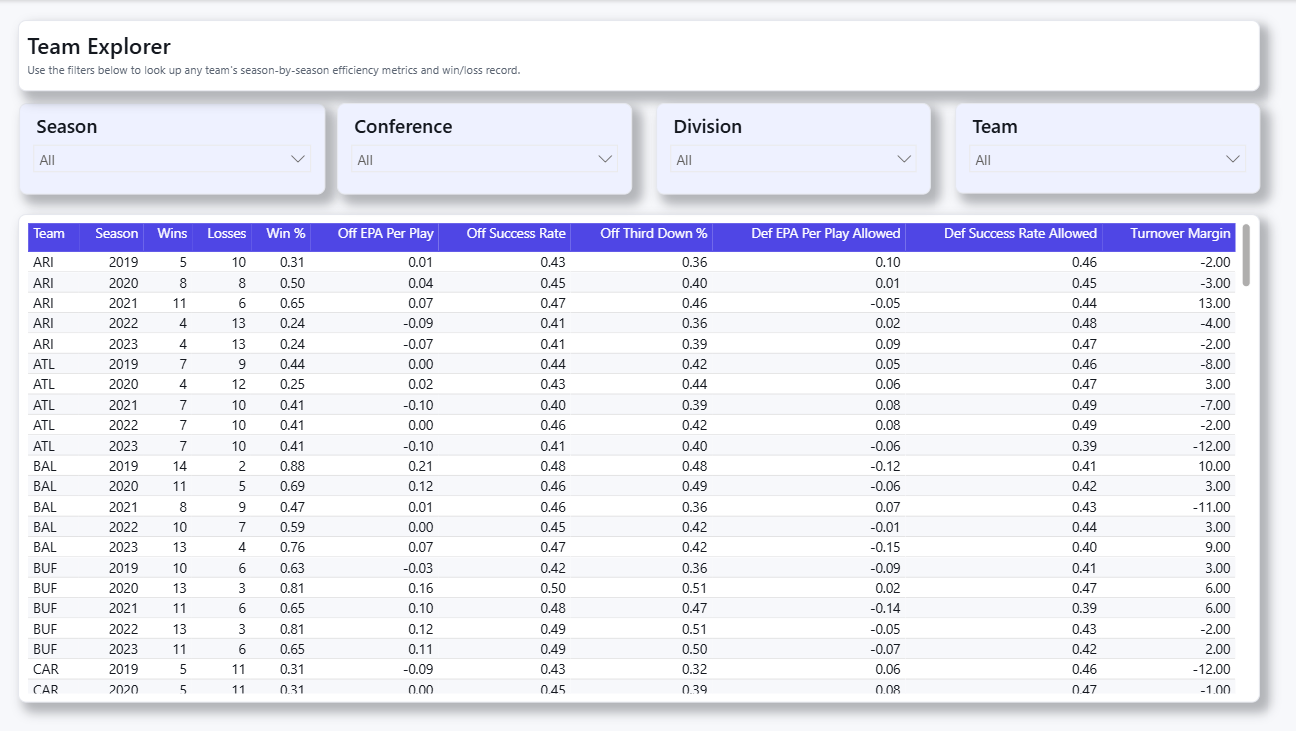
Click a screenshot to view full size. The dashboard also includes a plain-English Glossary page explaining EPA, success rate, and other stats for anyone without a football background.
View on GitHub2026 Chicago Cubs Season Dashboard
Description
A live analytics dashboard tracking the Chicago Cubs' 2026 season — real-time standings, advanced player ratings, and a Monte Carlo-simulated probability of winning the division and World Series, all built on data pulled directly from the MLB Stats API.
Key Contributions
- Built a SQLite pipeline computing Pythagorean win expectancy and division/league standings from live MLB Stats API and pybaseball data.
- Wrote a Monte Carlo simulator in Python that plays out the remaining regular season and playoff bracket thousands of times to estimate division, playoff, and World Series odds.
- Designed a 3-page Power BI dashboard — including a Player Ratings page with a bookmark-driven toggle to swap between hitters and pitchers on the same page — surfacing WAR, OPS+, ERA+, and FIP alongside plain-English definitions.
Outcome
An always-current tracker that updates as the 2026 season unfolds, showing at a glance whether the Cubs are outperforming their underlying run differential and how their playoff odds are trending.
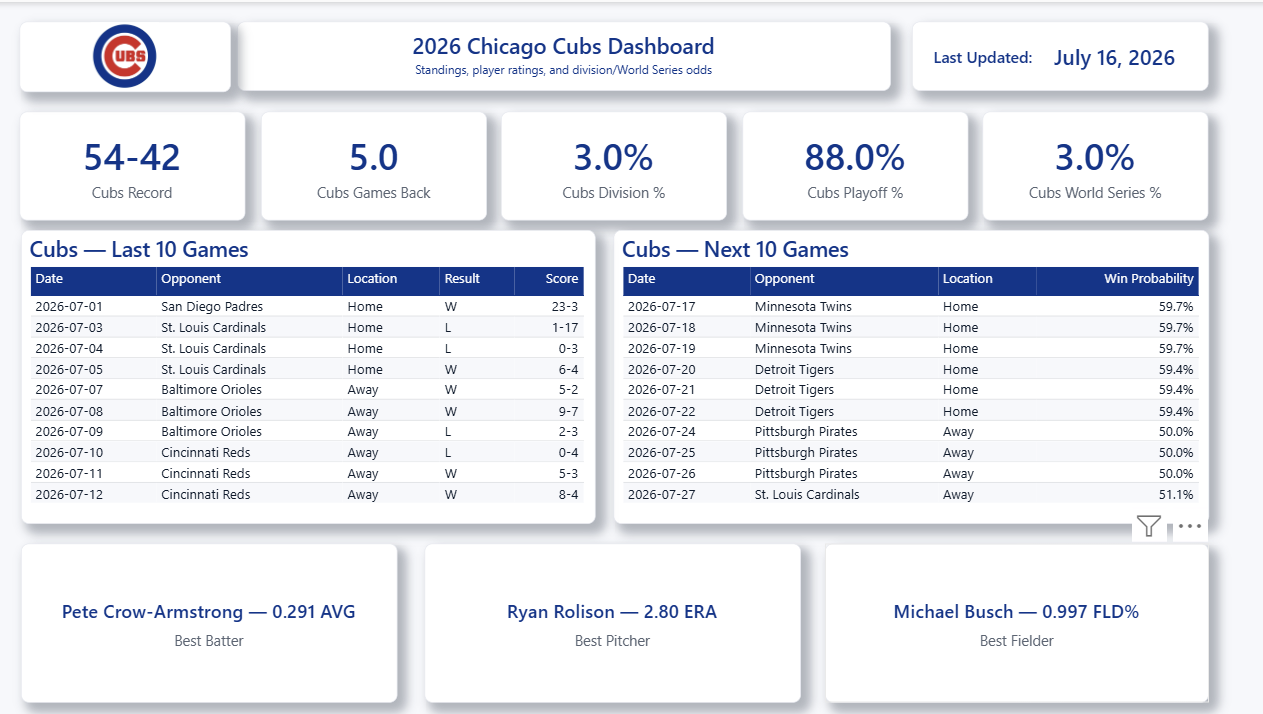
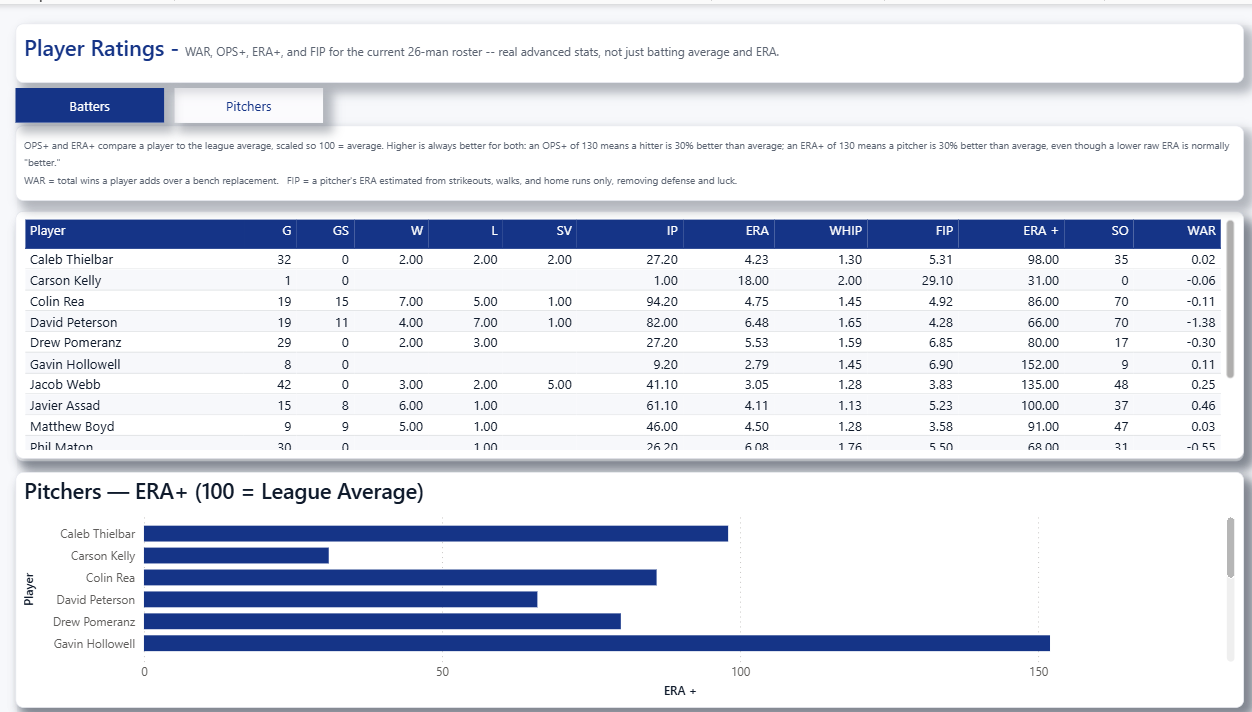
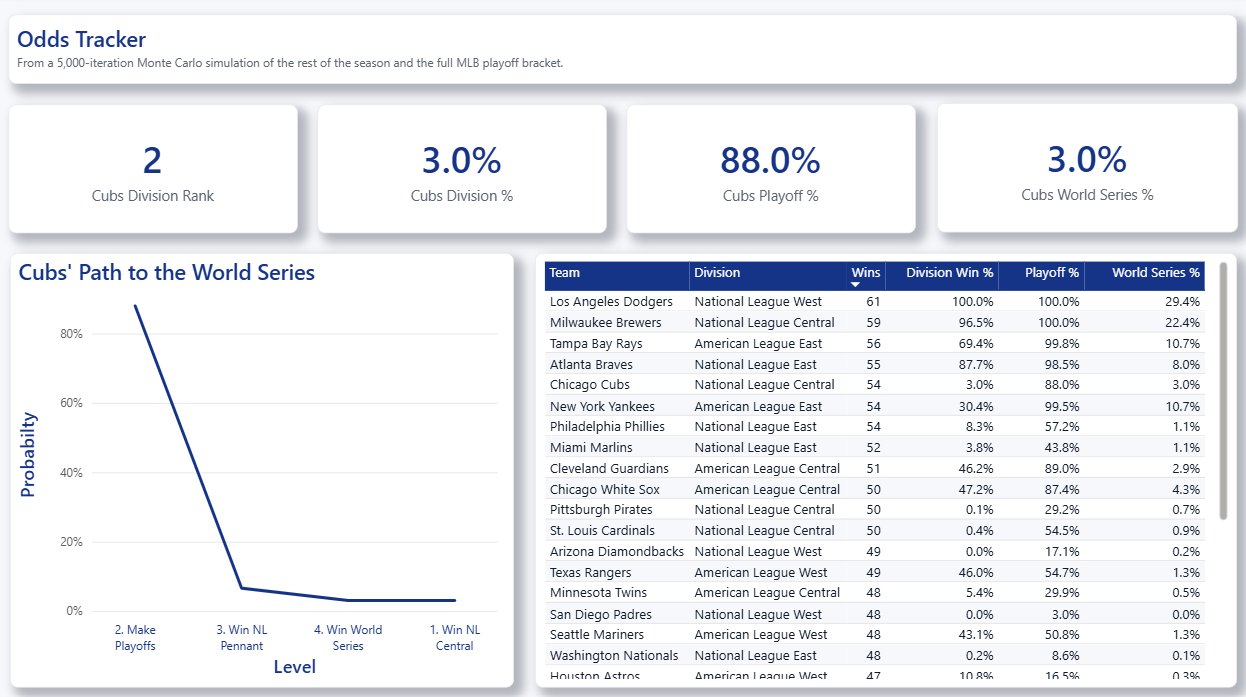
Click a screenshot to view full size. Player Ratings includes a Batters/Pitchers toggle button so both stat tables don't have to compete for the same screen.
View on GitHub